The past days have seen one particular sequence that shows up on HFT Alert Pro at 15:58:00, 2 minutes before the market closes. Steve Hammer of HFT Alert has written an article for Seeking Alpha in a effort to show people he and his buddies have created a platform that can help the average Joe and the Portfolio Manager not only identify algorithmic activity and also help them profit off it. Here are six graphs over the past 6 days of the "Late Comer" as we dub it here at Calibrated Confidence. Take note of the shape taken on by the exchanges and also note the blips that appear prior to the 15:57:48 burst. These charts come from HFT Alert Pro
Monday October 17th:


Thursday October 13th:

Wednesday October 12th:

Tuesday October 11th:


HFT or algorithmic trading has been in the spotlight since the May 6, 2010 “flash crash”. Since then, the nature and effects of algorithmic trading have been under considerable debate. Regardless of your viewpoint, algorithmic trading will likely continue to grow, leaving many individual investors with a sense of “it’s me versus the machines.” But there is now a new a tool to detect algorithms, which may help traders deal with and better understand the volatility some systems create; but first, a little background.
There are a number of classes of algorithms. Many are related to order entry systems for institutional portfolios and mutual funds, while others operate within the context of market making. Some are strategy-based systems, others trade news events and some are profiteering systems. Algorithms can be designed for legitimate purposes or they can be designed to take advantage of weaknesses in the system. Using a technique called ‘quote stuffing’ (originally coined by Nanex), the tape can be slowed enough that the system can front-run the tape and essentially make riskless trades. Other techniques can be used that increase volatility, affect the NBBO (national best bid or offer) or circumvent routing requirements. Then these systems can use their speed advantage in trading, which typically results in abnormal swings in price. Regulators are currently examining ways to curb these abuses.
Monitoring for algorithms can provide a benefit to those who are active in the market. It will allow us to know when price is being affected and give us better insights into the activity of these systems. Used together with breadth measures and other tools already used by many traders, monitoring can help us deal with and better understand an ever more computerized market.
Monitoring can analyze the tape in very high detail and detect the repetitive nature of many trading algorithms. It’s somewhat ironic that the higher the speed, the easier it is to detect them. Any burst of activity either in quote rates, number of stocks being affected or duration will be immediately apparent to the user.
For traders and portfolio managers, knowing what the other guy is doing is a huge advantage. If you knew the stock you were about to buy or sell was being affected by a “fluttering” algorithm, or that the sudden move in your stock was a result of a “cycle repeater” algorithm, you could make a more informed decision regarding that stock at that moment. While individual buy or sell orders leave no visible trail, algorithms do and we can detect them. When we as individual investors put in buy or sell orders, we mostly do it once and wait either for an execution or later change or cancel our order. When algorithmic trading enters an order, they do it several thousand times a second. They’ll enter an order then immediately cancel and change that order and do this up to 10,000 times in a single second. Why would someone need to enter then cancel an order more than once? For one of two broad purposes: either so-called ‘price discovery’ or for some manipulative purpose.Fortunately, some, but not all, of these algorithms can be detected and the stocks being affected identified. Monitoring can alert us to stocks that have very high quote rates faster than any other type of monitor such as a volume or price monitor. A sudden rise in quote rates over 5000 per second that sustains over a number of seconds typically results in a significant percentage move in price. Monitoring would alert you to this potential faster than any other type of market watching tool.
Monitoring for algorithms provides an insight into their behavior, what stocks they’re using and can explain why some stock prices move erratically. Absent of any news, spikes in price on an individual stock caused by a trading algorithm typically retraces most of that move in price. Not all can cause anomalous price movements and not all of them can be detected. In dull markets, it is very easy to identify the levels these systems are buying and selling.
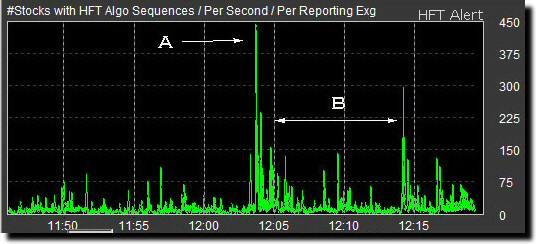
Here are some examples of the output of an algorithmic monitor. First, we can monitor for overall levels of algorithmic activity in the tape. The graphic below displays the number of stocks that have ‘algo sequences’ in them—that is algos found by our algos--across all exchanges. This is an indicator of overall market activity.
The large spike labeled “A“ represents over 450 individual stocks being targeted. This particular spike caused a ½ percent move down in the S&P index in less than 3 seconds. If you were not monitoring for algorithms at the time, the sudden movement in price may have been mystifying. Ten minutes later, another large spike, “B,” was also accompanied by a move down in price in the S&P. By examining the tape further, we can determine that both spikes were primarily sell programs.
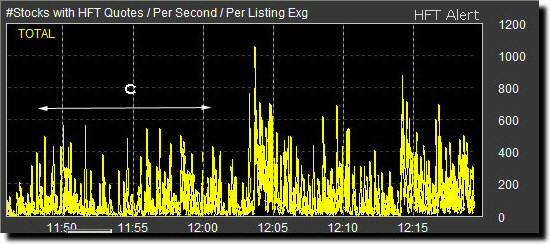
Second, we can monitor for quote rates across multiple exchanges shown above. High quote rates typically precede actual trades and can be used to anticipate program activity. Elevated quote rates, “C," preceded the spike shown in the upper graph by more than 10 minutes and maintained an elevated peak level after the initial spike. Elevated quote rates in excess of 1000 issues, shown above, can often be linked with ‘quote stuffing.’ This creates a latency arbitrage that profiteering systems can use to front-run the tape. Again, knowledge of when these systems are running will allow traders to adapt to them.
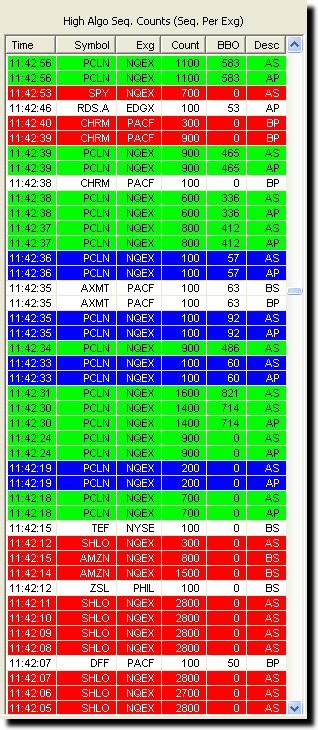
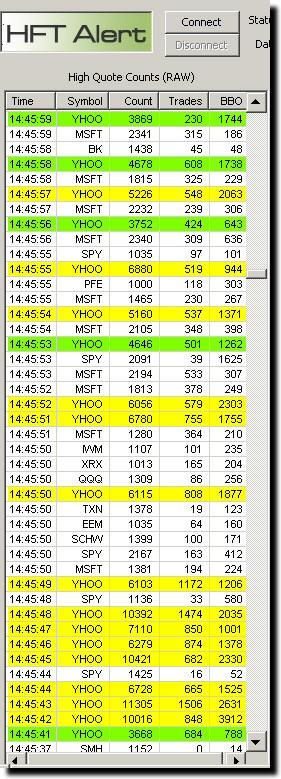
Third, we can identify the stocks being affected in a number of ways. Stocks with very high quote rates can be identified and those being targeted by certain types of algorithms. The table below identifies stocks with high quote counts above 1000/second. Yahoo (YHOO) is identified at 14:45:41 with quote rates exceeding 72,000 in 10 seconds. Monitoring provided this information before there was a big enough move in price to attract systems looking for rapid price changes or sudden increases in volume. Monitoring can enhance these other systems and alert the trader to a situation in a stock much faster.
Click to enlarge
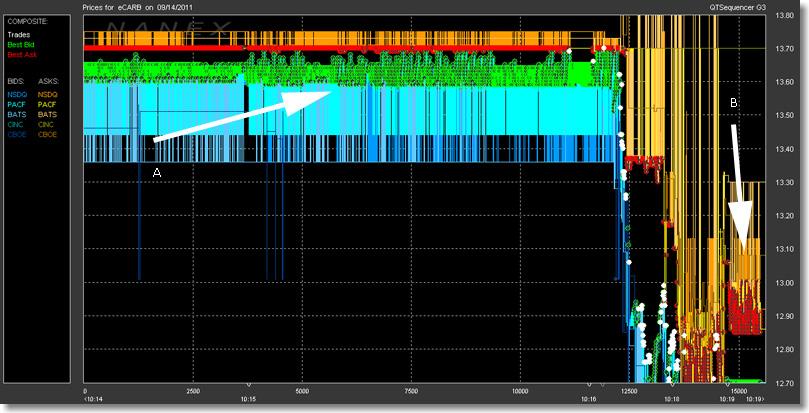
Monitoring can identify certain types of algorithms. In the table above, we see Priceline (PCLN) being affected by an AskSize and AskPrice cycle repeater. There are also other issues on this list that have BidPrice and BidSize cycle repeaters. Cycle repeaters move the bid or offer prices up or down very quickly over a range in price. This can result in erratic price moves over a fairly wide range in a short period of time as shown below on the symbol for Carbonite (CARB).
Click to enlarge
Arrow A points to a bid price repeater, arrow B to an ask price repeater. The white dots are trades as the algorithm forced price from 13.70 to 12.75 within a second of time.
Fourth, monitoring can identify unusual algorithmic behavior. For five consecutive days during the week of Oct. 10, 2011, at 3:58pm, an algorithm began to execute on over 400 stocks across primarily 5 exchanges shown below. It is unusual not only because it has only run during these five days, but also because it is slow moving. Typically, algos run in multiple bursts, each lasting no more than 1 or 2 seconds. This one runs for a full minute. Research into what it is doing is ongoing as of this writing.
Click to enlarge
Monitoring a list of stocks for algorithmic activity will provide the investor or portfolio manager information about potential activity in their stocks. Monitoring small cap or lesser liquidity issues is very helpful because any algorithmic activity shows up very quickly. This is especially true for many preferred issues and in dull markets algorithmic activity really stands out.
Monitoring for algorithms provides the knowledge of when and which stocks are being affected by programs and gives us better insights into the activity of these systems. Used together with existing market analytics and other tools already used by traders, monitoring can enhance these capabilities and help us deal with and better understand an ever more computerized market. It does not have to be “us versus the machines” if we know when the machines have been turned on. It just may be our best defense against them now that they can’t hide so easily in the tape.
Disclosure: I own HCMI which distributes HFT Alert, a real time HFT and algorithmic trading monitor, through the website hftalert.com. The technology behind HFT Alert was developed by Nanex LLC. The opinions expressed are my own.