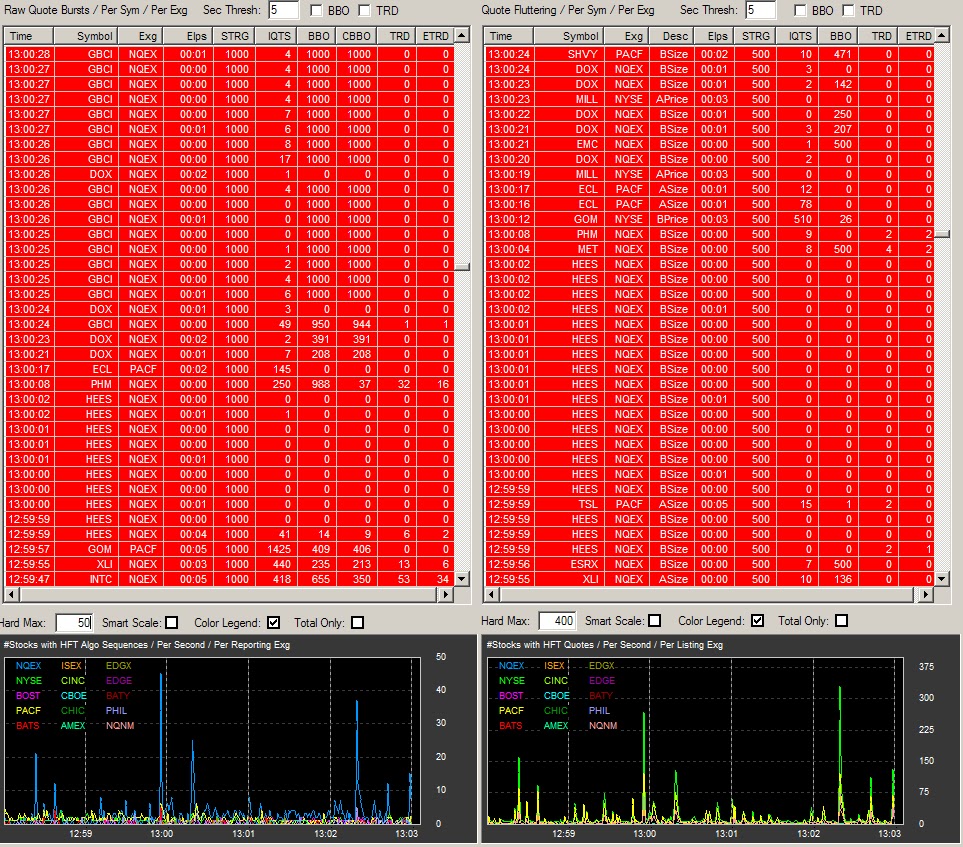
Much to our dismay we are sorry to report there was no special "Late Comer" algo today. We'll still maintain a list of recent sightings. Either way we do have some new, granular information to bring to the table from today's excitement. 13:00:00 was the beginning of a distinct increase in HFT activity in the market. The chart below will show you this. For those not familiar with this form of graphing or HFT material in general here is a quick break down:
Both charts show a collection of exchanges that display, at any given time, the number of HFT Quotes inside of 1 second, as detected by HFT Alert Pro's proprietary algorithm. You can see the dominant colors on the left chart are green which represents the NYSE, yellow which represents the BATS and pink which represents NQNM. The dominant colors on the right chart are blue which represents the NQEX, purple which represents the PHIL, red for the BATS and yellow for the PACF.

Here is the S&P 500 (price only index) for today and it is obvious that around 13:15:00 heavy selling came in and probably tripped some stop-loss triggers that enabled the quick drop.

Next we'll look at the period before the drop off for two reasons
- We want to see if the HFT Alert charts picked up any surges in activity (they did)
- We want to see if any bursts may have been used to "paint the tape" and also if there was any "fluttering" (there was)
What you will see clearly are the zero's on both tables in the trade columns (TRD) and the trades on other exchanges (ETRD). The TRD represents trades made on the exchange (EXG) listed, in this case it was mostly Nasdaq but you'll see some PACF and NYSE references in there. The ELPS column represents the time elapsed from when the sequence began until it hit 1000 quotes (STRG).
HEES was hit first just before 13:00:00 and we see the spike on the Algo Sequence chart on the left (3 Seconds for 11,000 quotes and only 8 trades) never once making the best bid or changing the best bid (BBO and CBBO respectively). Only 5 trades we made during the fluttering period, observable on the right table.
From this period in time until the drop in the S&P 500 which began during the 13:16:00 minute the HFT(s) ran through a plethora of assets, including preferred shares (GM). The next image is the same as above but it highlights the beginning of the 13:16:00 period, when the S&P 500 began to slip down. This time around the bot was able to pick up some trades and you'll notice it executed more trades on exchanges other than the NQEX on 3 efforts, most likely taking advantage of the speed delay an arbitraged the price difference.

Next we'll hit up the 13:28:00 minute which will lead us to the fatal 14:02:00 minute of the day. I lined up the 13:27:13 mark and with what you know so far from this post, I'm sure you can deduce what these tables are showing. Take you time and look them over. This happens everyday, in various asset classes, at varying lengths of time and intensity.

Here we'll look at a third table from the period for the beginning of the second S&P 500 take down. This is the Cycle Repeater table. HFT Alert Pro has identified an Ask Size Cycle repeater which ran on 4 separate occasions (more egregious examples of algorithmic characteristics can be found here from Nanex).

And finally here is the table of Cycle Repeaters for the time period before the 7 point drop in the S&P 500 or 0.5%.

And there you have it. You now know, with actual, factual data, how the S&P 500 was brought down 1.39% with High Frequency Trading. It was engineered up, engineered to break stop-loss ordered, engineered to give the tech traders some hope of a retracement around 1220 then crushed twenty minutes after that. Calibrated Confidence gets upset when people like this guy come out and try to comfort people when there is no justification for it. Those of us with HFT Alert running by our side are well aware of the dangers of HFT and now, after reading this, you do too. We wish you all well in the coming months as these things grow and become more mature, making it harder for the humans.
As a farwell message we leave you with a collection of charts from today October 19th, 2011 courtesy of the baddest algo of them all @badalgo.
ENV goes from $9.48 to $0.02 in 1 second


And lastly there has been hot debate on the liquidity providing ability of algo's.
From NANEX:
This is an update on the eMini Depth of Book drop-off we noted earlier. The depth of book has still not recovered to July levels.
The chart below shows the minimum of either the sum of the 10 bid levels or sum of the 10 ask levels in the active eMini futures contract depth of book for each minute of every trading day since June 1, 2011. The thick red line is yesterday.
The peak between 12:45 and 12:50 is fascinating because it occurred shortly before the Bernanke speech at 13:15. Before market impacting news, eMini liquidity always drops like a rock -- note the down spike at 10:00 when most major economic news is released. The other feature of interest: liquidity nearly always surges higher into the close, but yesterday, it remained flat.
