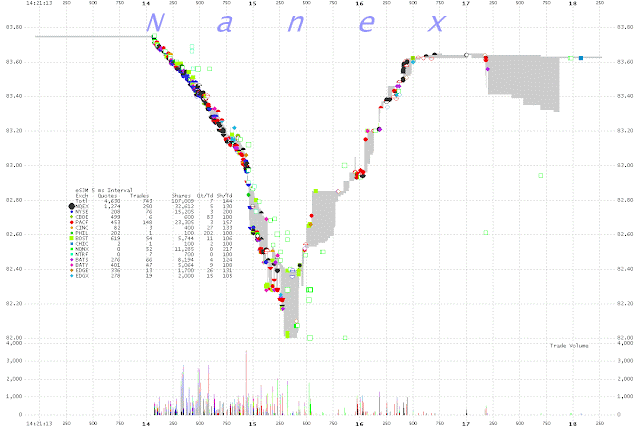
At 14:21:14 Smucker's was hit with an algorithm that drove the price down from $83.75 to $82, a mini flash crash of 2.09%. I called their Investor Relations department and spoke to a woman who confirmed there was no news release. Surprisingly she laughed as I asked her what happened (I knew what happened full well thanks to HFT Alert) and if I were a long-term holder of equity assets I would have sold my holding immediately. The sheer ignorance of laughing when, as far as she knew, she was talking to SJM investor is completely unacceptable and anyone holding SJM ought to be fearful when the companies Investor Relations lady just laughs at a 2%+ change in price in 2.5 seconds.
What you saw:
What I saw:
Number of stocks with HFT Algorithmic Sequences by reporting exchange:
At 14:21:14 HFT Alert picked up the first of two sequences:
HFT Alert Pro showed the sequence lasted for 5 seconds:
Nanex's data shows PHIL exchange took 202 quotes per trade. Note on the first that at 14:21:15.500 and 14:21:15.875 there are two clear trades at the $82 level while simultaneous trades at $82.23 (give or take penny given the spacing on their charts) and $83.00 were made, respectively.
From NANEX:
1. SJM 5 millisecond interval chart showing trades color coded by exchange.
2. SJM 1 second interval chart showing trades color coded by exchange.
3. SJM 1 second interval chart showing bids and asks color coded by exchange.
4. SJM 25 millisecond interval chart showing bids and asks color coded by exchange.


