More of the same today and the machines moved so fast the humans could not respond quick enough. So those tight spreads, didn't stop Apple from trading $27 below its spot price this morning at 9:51. Thanks to SEC regulations, stub quoting has been banned, but as we know with Madoff, the SEC doesn't understand much of anything that goes on in the market, therefore we get awesome private companies like Nanex which help traders stay informed, in near real-time.
One thing I would like to point out, if you see these long extension candles on your platform, go back using 5 min time intervals for about 2 years, or however long you'd like. Zoom in enough to see each day and slowly scroll through the chart. Make circles at the peaks of the extensions candles and you should notice, at least for SPY, that when there are extensions to the down side, price rises. Also, when there are extension to the upside, price subsequently falls. Something to keep in mind if you're a trader with out HFT hunting software.
Apple 1-Minute Price chart

The trades were eventually cancelled:
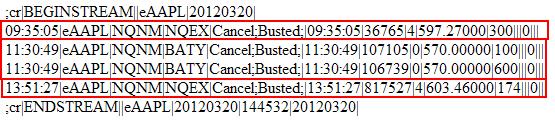
From NANEX:
AAPL Stub Quote
A stub quote $27 below best bid executed in Bats-Y.

One second interval chart of AAPL showing BATS trades (pink) and NBBO (National Best Bid/Offer) shaded gray for normal market, yellow for locked market (bid = ask) or red for crossed market (bid > ask).

Also I had posted on twitter regarding some extreme Quote sizes in SLV, USO, and YHOO. Remember, for the quote pattern to show up in the platform, 1,000 initial quotes are needed so add that to the IQTS (# of quotes) and you will have the full quotes. No divide that by ELPS and you'll have a very rough idea of the average quotes/sec (could vary depending on the structure of the program, some may quote more as the sequence runs on, leaving the final second with 2x the amount of quotes per second as the first second). Finally, TRD are the trades made on the listed exchange (under EXG) and trades made on other exchanges are recorded under ETRD. Scroll half way down the page here for more information on this.
Nanex also reported:

Here are other examples I saw in real-time with HFTAlert Pro:
Example 1
SLV 1 Minute Chart

SLV HFT Alert Pro Raw Quote Bursts

Example 2
USO 1 Minute Chart


Example 3
Yahoo ran real hard for an extended period as more Red Bloomberg Headlines ran regarding them seeking liquidity and offering up part of its business to Alibaba. You'll notice on the first table that YHOO was quoting and trading across 6 different exchanges. When the largest candle appeared on the price chart, YHOO traded Nasdaq (NQEX) only.
YHOO 1 Minute Chart


YHOO HFT Alert Pro Raw Quote Bursts staring at 14:26:41 and running until 14:28:20
