Nanex just released a report on the VWAP blast yesterday on WAB. If you are subscriber to HFT Alert Pro what you saw at 15:53:13 was on the Nasdaq a blast of 4400+ quotes, that took 2 seconds to complete a recognized algo cycle, which means it started running at 15:53:11. During that time the algo began a new cycle on the NYSE that took 3 seconds to meet the characteristics that would identify it. In that time periods, the stock price rose from $64.22 to $69.33. Below is the text image that comes in real-time from HFT Alert Pro.
On December 14, 2011 at 15:53:11, the stock Westinghouse Air Brake Technologies Corp (NYSE:WAB), suddenly exploded from $64.22 to $69.33 in just over 1 second. Just 3 seconds later, the price was back under $65. Most market structure problems caused by an algo running wild are confined to a few exchanges (rarely more than 3) and the NBBO ends up nearly always locking or crossing. In the WAB event, the NBBO never locks or crosses (not until after the price returns below $65), even with all 11 exchanges participating. The number of exchanges involved, plus the speed and magnitude of this move, and the fact the NBBO doesn't lock or cross is simply unprecedented.
WAB has a market cap of $3.1 billion and trades an average of 240,000 shares a day.
There were no news events during the day, and no news events the following day.
No trades were canceled by the exchange.
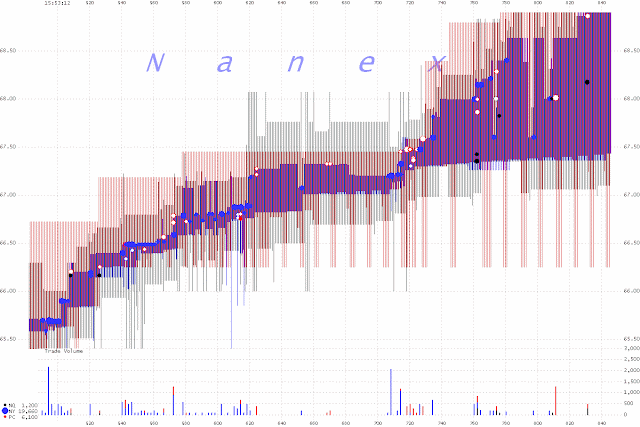
Below are 2 sets of 1 second interval charts; the left chart shows trades and trade volume, the right shows the NBBO quote (black shade) and quote rates. Note the sharp the spike in the NBBO. The spike is just noticeable on a 1 second interval, any resolution at larger time frames (e.g. 1 minute bar chart) would make the spike appear as a single bad price tick.
The next two charts are zoomed in views at 20 ms intervals.
Zooming further to 5 ms intervals.
The next chart shows the NBBO at on 1 millisecond basis. Note how quickly and often the NBBO changes. This chart shows about 1 second's worth of data.
The chart below shows 3 of the more active exchanges during this event. The bid/ask spread for each exchange is shown as vertical lines, which are color coded according to the legend at the bottom. Note how quickly quote prices change on each exchange. This chart shows less than 1/2 second of data.
After looking at the data during the event, we happened to look at trades executed after the close and found 15,700 shares executed with a trade condition of "average price", which usually means VWAP trades. So we dumped all trades and computed the VWAP. Our computed VWAP matched (to 3 decimal places!) the price that the "average price" trades were executed.
We wondered what the VWAP would be if the price spike never occurred. Answer: about 50 cents lower. On 15,700 shares, it's about a $7,000 difference.
We can't help wondering that since the event happened only 7 minutes before the close, if someone knew the trade was coming and tried to jack up the prices, and it ended up getting away from them, or maybe they intended it to be as spectacular as it was?
The chart below shows WAB trades (red), the running VWAP (blue), and our estimated VWAP (green) if the price spike never occurred.


