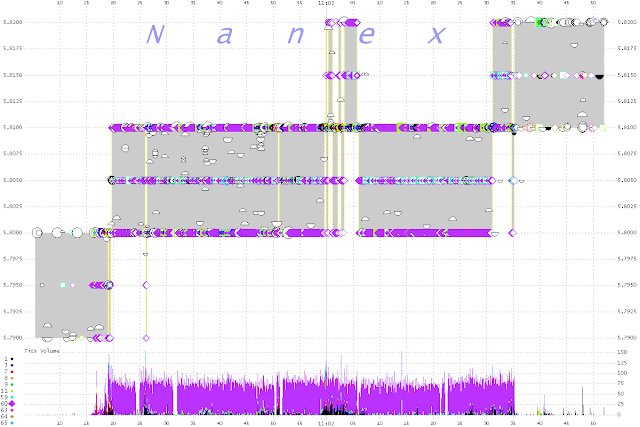
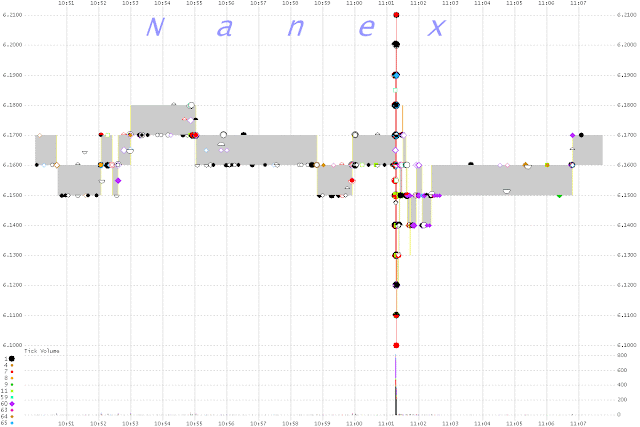
Eric Hunsader over at Nanex who has been the factual benchmark for all things HFT has released some images from this morning. We have seen a few abnormalities today (here). The BATS exchange was hit around 11:00:33 and BAC and PDLI are the shining stars of the debacle. We addressed the issue of government rules and the global officials that are either to incompetant to figure this out themselves or they are on the HFT payroll and play the best promoter and scam artist. The SEC sees no benefit to analyzing millisecond data. The UK Treasurer thinks HFT shows no "direct evidence" of causing price movement (articles here)
From NANEX:
Bank Of America
BAC ~ 1 second chart on Dec 9, 2011
Circles are trades. Shaded area is BBO (1=NQ,7=ARCA,60=BATS)
BAC ~ 1 second chart on Dec 9, 2011
Shaded area is BBO. Shows Quote Rate.
BAC ~ 100 millisecond chart on Dec 9, 2011
Circles are trades. Shaded area is BBO
BAC ~ 100 millisecond chart on Dec 9, 2011
Shaded area is BBO. Shows Quote Rate.
PDL BioPharma
PDLI ~ 1 second chart on Dec 9, 2011
PDLI quotes on Dec 9, 2011
(1=NQ,7=ARCA,60=BATS)
PDLI Quotes and Trades


