From Nanex:
On October 7, 2011 beginning at 12:03:39.950, a massive surge of quotes in SPY, IWM, DIA and other market index ETFs, along with many symbols in the Dow Jones Industrial Average, caused an overload in CQS that lasted several seconds. This, in spite of a 25% increase in CQS capacity just 3 days earlier to a whopping 1.25 million quotes/second. During this event, Nasdaq quotes into CQS became delayed at least 800 milliseconds (800,000 microseconds). Other exchange quotes feeding into CQS also became delayed.
We found many symbols with trade executions that appeared several hundred milliseconds before the quotes that could have produced them. How does one ensure trade-through price protection if the price being protected hasn't even occurred yet?
Given the evidence from this event, we have to conclude that Reg NMS must have been secretly rescinded: at least the part that talks about trade through price protection, the NBBO (why is it still being computed?), and the importance of keeping the feed affordable.
From the data we have looked at so far, we estimate that CQS capacity needs to be increased to at least 6 million quotes/second in order to avoid becoming overloaded. This would be the capacity for a normal trading day. The capacity to handle a surprise news event, would of course, need to be much, much, higher.
To be clear, we are not advocating increasing CQS capacity at all, mostly because all this extra quote traffic is pure non-sense and has no value what-so-ever. It's mostly coming from new HFT, and interactions between HFT algorithms trying to out fool each other. Something that a regulator doing their job would have put a stop to a long time ago.
The next time the market receives a shocking news story, or undergoes unusual stress, the only traders who will have accurate market prices will be those co-located at the exchange. Just like on May 6, 2010.
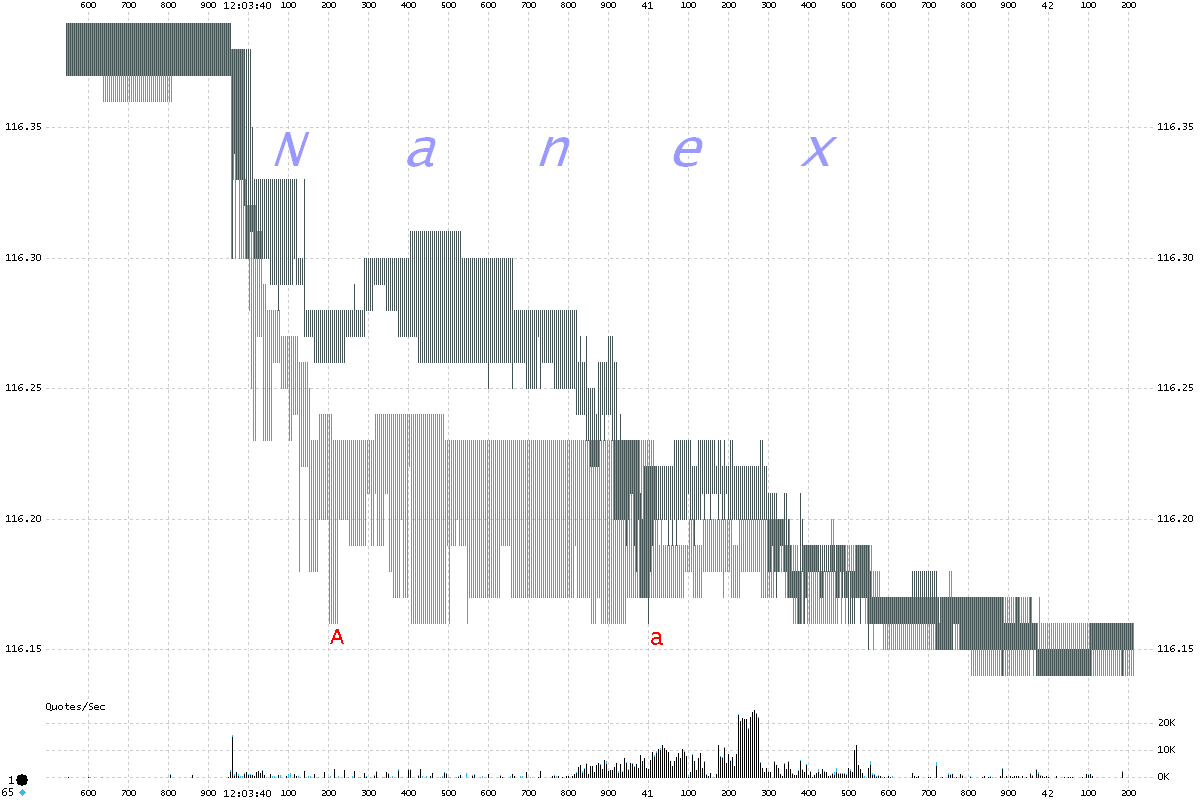
Below is a 5 millisecond interval chart of SPY showing Nasdaq trades (circles) and quotes (shaded vertical lines). The distance between the points labeled A and a is the minimum time that trades came ahead of quotes.

Below is a 5 millisecond interval chart of SPY showing quotes from EDGE (blue) and Nasdaq (black). The distance between the points labeled A and a is the approximate amount that Nasdaq quotes were delayed relative to EDGE.
The chart below shows the quote rate per exchange going into CQS over the same period and interval as the charts above. The bottom panel shows each exchange's quote rate as a percentage of all quotes going into CQS. You can see the wild oscillations in the red line (Nasdaq) correspond to the dribbling of quotes in SPY above (Between 12:03:40.050 and 12:03:40.800). Around the 12:03:40.800 mark, Nasdaq quotes suddenly surge accounting for more than half of all quotes going into CQS. If you look closely, you will see other exchange quote rates also oscillate at this time in a round-robin fashion.

Below is a close-up of of the chart above, with a few exchanges removed for clarity.

Below is a 5 millisecond interval chart of IWM showing quotes and trades from BAYS (purple) and Nasdaq (black). Here, Nasdaq quotes are delayed, but so are the trades.

Below is a 5 millisecond interval chart of IWM showing quotes and trades from ARCA (red) and Nasdaq (black). You can see ARCA trades (red circles) are coming before the quotes (red vertical lines) that executed them.
