
What I present is an on-going analysis done by Calibrated Confidence of the 10 year Constant Maturity Treasury against the Y/Y change in CPI-U. Once the data was organized I ordered the CPI-U as "CPI < 0", "0 < CPI < 2", "2 < CPI < 5", "5 < CPI < 10", "CPI > 10". The behavior of real rates of return (Fisher's equation) against the nominal rate on the 10 Year CMT varies in a statistically significant way under various inflation expectations. Something to note: Yields on bonds can take as long as 28 months to reflect the changes in CPI.
In the order listed above, we'll walk through the evidence of what Amerika is in for and we predict that as the population continues its full on press to seek "normalcy bias", the elitist will be able to manipulate the system on larger scales and you can expect more volatility and less certainty, especially once generation RX decides (if ever) to grow up. The data below speaks for itself. Note also as your look at the graphs, notice as inflation grows the observations become more scatters, almost like a cone, that's uncertainty and that's where the US is headed.

The correlation presented for you below was run under the assumption that "0 is not constant" (basically mean the coefficient for the intercept is any number other than zero). After this you will see the summary statistics for when I choose to assume "0 was constant" (the intercept is 0). The correlation goes from 34% to 74% and the t-stat is substantial (this finding was true through all the time periods under both of the assumptions regarding the intercept coefficient.
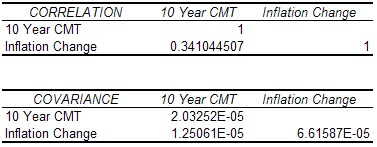

Basically, as the rate of inflation goes negative (ie. the price index drops say from 30 to 25), the relationship of US 10 Year CMT drops also. The equation I deduced for this scenario to be able to predict either 10 Year CMT or Expected CPI-U given the other is:
0 < CPI < 2 (114 Observations)10 Year CMT = 0.0354 + 0.1890 * (Expected CPI-U Change)

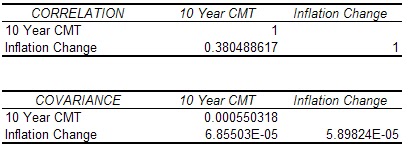
Again here you'll see that the correlation is 30.36% under the "0 is not constant" assumption. When "0 is constant" the correlation jumps to 91.95 and t-stat is a whopping 24.87, compared with the limit for 99.5% predictability at 2.66. This should be expected given that this period and the next are a) the ones with the most observations and b) the groups with the CPI in the Federal Reserves 1-3% range.


The equation I deduced for this scenario is:
10 Year CMT = 0.0372 + 0.6743 * (Expected CPI-U Change)
2 < CPI < 5 (342 Observations)

Another instance below of where the correlation jumps from 38.05% under "0 is not constant" to 94.46%. I'll let you see the t-stat.

The equation I deduced for this scenario is:
10 Year CMT = 0.0257 + 1.1622 * (Expected CPI-U Change)
5 < CPI < 10 (131 Observations)
Enjoy this predictor plot. What you can obviously conlude from this is that the Treasury and Fed lose total f__king control as inflation passes 5% per year. Neither of the organizations can handle it (surprised?). The saying goes "once the lion is out, it can't be tamed". Bernanke is about to get his ass chewed off (provided the citizens don't hang him in the street for treason). This entire scatter is a mess. There is no way to predict what will happen with risk-free rates as inflation passes 5% Y/Y and approaches 10%.


The equation I deduced for this scenario is:
10 Year CMT = 0.0774+ [(-0.0422) * (Expected CPI-U Change)]
CPI > 10 (58 Observations)
And to round out the group, here are the stats for CPI above 10% Y/Y.


The equation I deduced for this scenario is:
10 Year CMT = 0.0632 + 0.2239 * (Expected CPI-U Change)
As observed in the world, the US managed to increase it liabilities through spending without an equivalent increase in output. The only way to achieve revenue going forward will be to print money in order to monetize the debt. With this next round, inflation increases again and the real rates of return will force money to flee the US which will exacerbate the problem and leave a large chunk of the population in really bad shape, financially and mental. Consider the historical performance of the 3 month CMT and 10 Year CMT. See it for yourself:

Now for the absolute mess. What you'll see here is that as the rate of change for M2 Money Stock goes absolute 10% Y/Y, real rates become negative. Try not to get a headache:

I have nothing left to say. Just think about this and try to figure out what is more important to you over the next 10 years. $100 monthly payments on the cell phone, or $100 monthly payments toward buying physical gold and silver? In the words of Hollywood:
Bernanke's Paper:
Read Here